Mathematics of Trading: Variance, Drawdowns, and Risk of Ruin
Why Even Great Strategies Hurt, Why Survival Is Not Guaranteed, and Why Variance Shapes Your Entire Trading Journey
- Why do profitable strategies still experience long losing streaks?
- Why do drawdowns happen even when expected value is positive?
- Why does variance make edge difficult to detect?
- Why does volatility drag reduce long-term returns?
- Why do traders blow up even with a positive EV system?
- How does position sizing determine survival?
If expected value tells you the destination, then:
- Variance tells you how chaotic the journey will be
- Drawdowns tell you what that chaos feels like
- Risk of ruin tells you whether you’ll survive the journey
These three concepts are the mathematical reality of trading — not optional, not avoidable, not solvable through indicators or prediction.
This is one of the most important posts of the entire series.
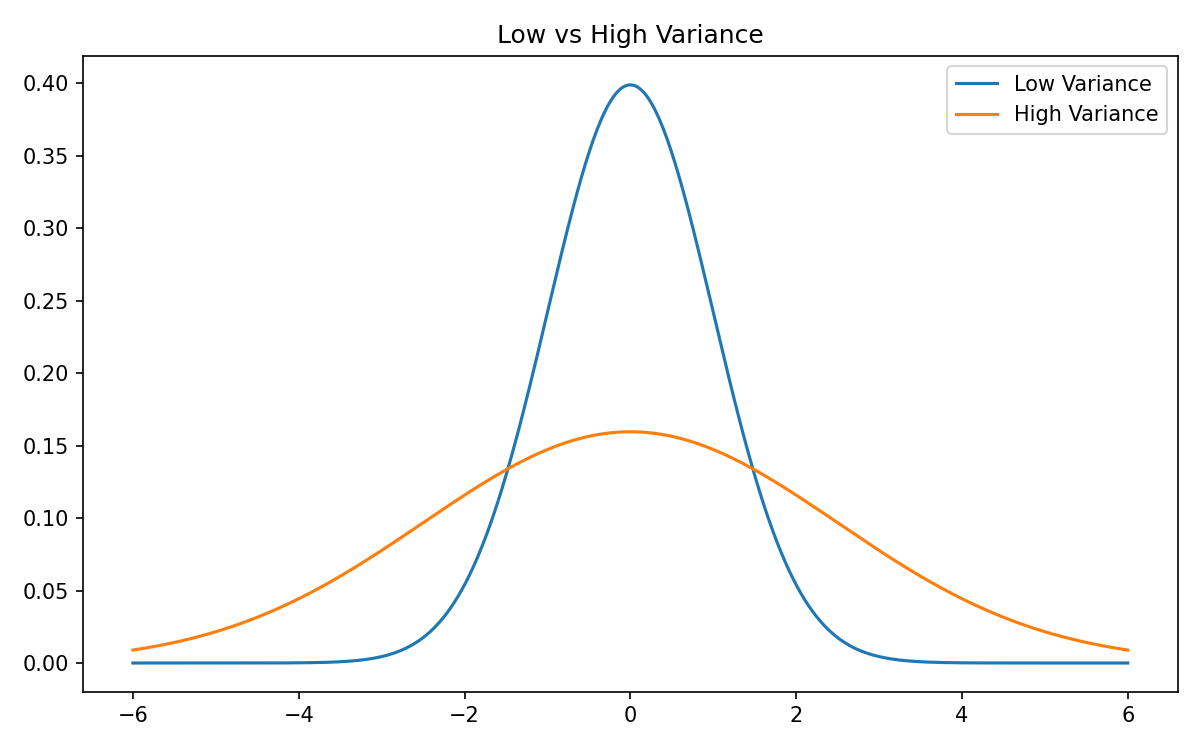
Variance: Why Your Equity Curve Never Goes Straight Up
Variance measures how widely outcomes fluctuate around their expected value:
If mean is the destination, variance is the turbulence along the way.
- Low variance → smooth experience
- High variance → wild swings
Variance does not change your expected value. It changes how difficult the strategy feels to execute.
Variance explains:
- why good traders lose
- why systems experience streaks
- why drawdowns happen
- why confidence is fragile
- why sizing must be small
Variance is the hidden cost of every trading edge.
Standard Deviation and Volatility
Volatility is simply:
In financial markets, volatility = uncertainty of returns.
High volatility environments include:
- panic events
- liquidity collapses
- systematic unwinds
- regime shifts
Low volatility environments include:
- grinding bull markets
- mean-reverting ranges
- stable macro periods
Volatility is not noise — it’s information about the market’s state.
Variance Determines Losing Streaks
If your system wins with probability (p), it loses with probability:
The probability of (k) consecutive losses:
Example: Win rate = 40% ⇒ Loss rate (q = 0.6)
- 5 losses in a row: (0.6^5 = 7.8%)
- 7 losses in a row: (0.6^7 = 2.8%)
- 10 losses in a row: (0.6^10 = 0.6%)
Every strategy has losing streaks baked into the math.
If you don’t understand variance, you will abandon positive-EV systems during perfectly normal streaks of losses.
Same Expected Value, Different Variance: Very Different Experience
Two strategies can have the same EV but wildly different variance.
Example:
Strategy A
- 80% chance of losing $20
- 20% chance of winning $120
Positive EV — amazing!
But variance is enormous:
- 8 winners per 100 trades
- 92 losses
- emotionally brutal
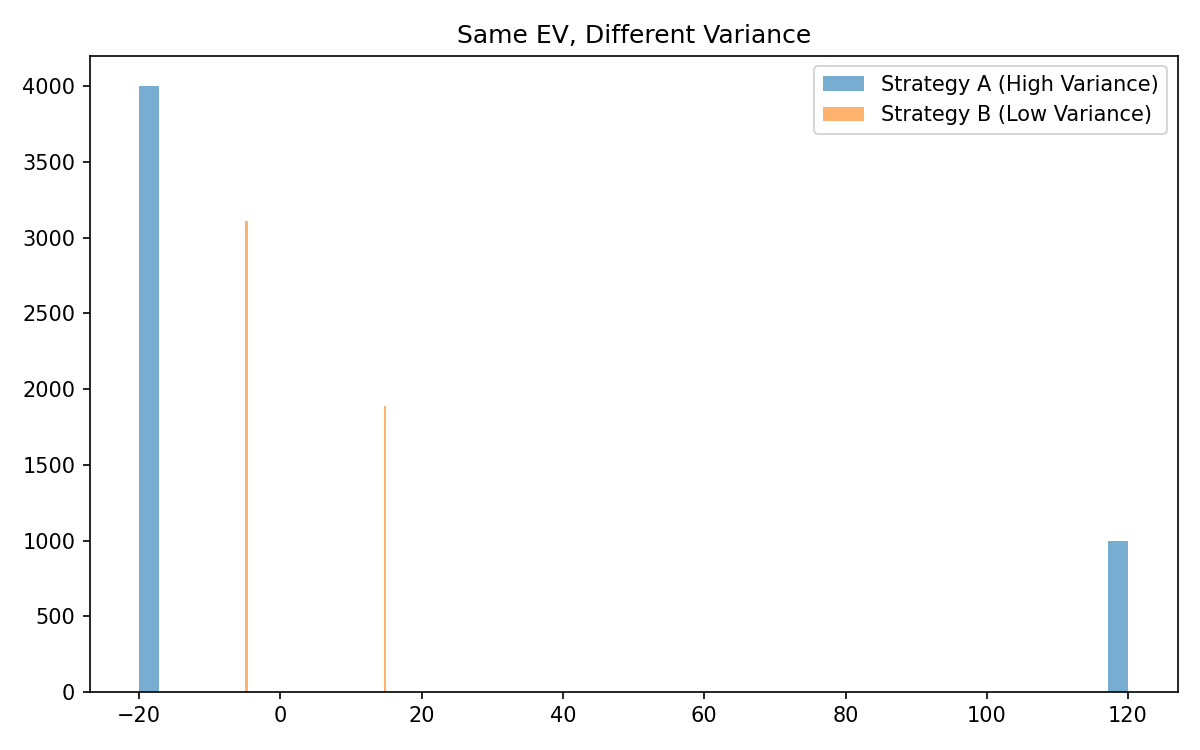
A trader rejecting this system because it “feels wrong” is rejecting variance, not rejecting EV.
Variance Drag: Why Volatility Reduces Compounded Returns
Arithmetic (simple) mean return:
Geometric (compounded) mean return is approximately:
Meaning:
- high volatility reduces compounded return
- variance literally destroys growth
This is why two strategies with identical EV produce different long-term wealth:

Variance is not just discomfort. Variance directly reduces your long-term performance.
Variance Creates Drawdowns — Drawdowns Are Variance Over Time
A drawdown is the drop from the most recent peak:
Drawdowns have three components:
- Depth
- Duration
- Frequency
All three matter more than returns in defining your psychological journey.
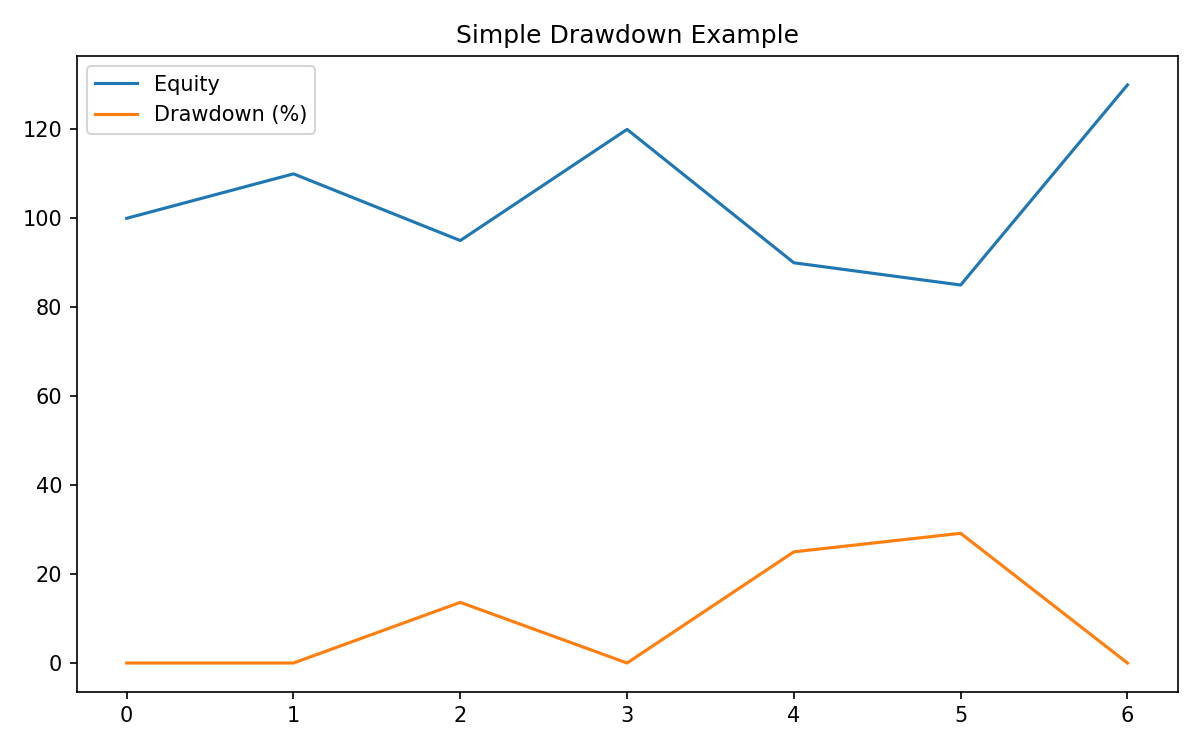
Drawdowns are not failures. They are the normal expression of variance.
Drawdown Depth: How Bad It Gets
Depth is driven by:
- variance
- skew
- tail risk
- volatility regime
- position size
Even high-EV strategies suffer deep drawdowns in turbulent conditions.
It is mathematically impossible to run a strategy with non-zero variance and have no drawdowns.
You must choose the depth of pain you’re willing to endure.
Drawdown Duration: The Silent Killer
Duration determines how long you remain underwater.
A 20% drawdown lasting 1 week is annoying. A 5% drawdown lasting 8 months destroys confidence.
Long drawdowns cause:
- doubt
- fear
- questioning the system
- abandoning strategies at the worst time
A painful truth:
Most traders don’t quit because of depth. They quit because of duration.

Drawdown Frequency: The Strategy’s “Emotional Signature”
Examples:
- Positive skew strategies → frequent shallow drawdowns
- Negative skew strategies → rare but catastrophic drawdowns
- High variance strategies → frequent deep drawdowns
- Low variance strategies → mild but persistent drawdowns
You cannot eliminate drawdowns. You can only choose which type you want.
Maximum Drawdown (MDD) Is Necessary but Not Sufficient
Maximum drawdown:
But MDD hides:
- whether drawdowns are common or rare
- how long they last
- whether the strategy frequently retests lows
- whether the strategy has fat-tail risk
Drawdowns are path-dependent, so two identical EV systems can have wildly different MDDs.
Drawdowns Scale with Volatility (Roughly σ√T)
A useful approximation:
Meaning:
- higher volatility → deeper expected drawdowns
- longer time horizon → larger inevitable drawdowns
Drawdowns are not anomalies. They are statistical inevitabilities.
Drawdowns Lead Directly Into Risk of Ruin
Ruin occurs when:
- capital falls below usable levels
- leverage creates forced liquidation
- drawdowns trigger abandonment
- confidence collapses
- margin calls occur
Most traders hit emotional ruin before mathematical ruin.
Ruin is hitting a point of no return, not hitting zero.
Ruin Probability in a Favorable Game
For a simplified favorable game:
- win probability: (p)
- loss probability: (q)
- loss size: (a)
- starting capital: (C)
An approximation:
Key intuitions:
- Doubling position size more than doubles ruin risk
- Higher volatility increases ruin risk
- Low capital increases ruin risk
If EV < 0 → ruin probability = 1 If EV = 0 → ruin probability = 1 (eventually) If EV > 0 → ruin probability is not zero unless position size is tiny
Kelly Criterion: Optimal but Dangerous
Straight Kelly fraction:
where:
- (b): win-to-loss payoff ratio
- (p): win rate
- (q = 1 - p)
Kelly maximizes long-term growth in theory.
But in practice:
- full Kelly = enormous drawdowns
- half Kelly = much safer
- anything above Kelly = guaranteed ruin
A key result:
Full Kelly betting has a 50% chance of losing 50%.
This is why traders rarely size anywhere near Kelly.
Leverage Makes Ruin More Likely Even in Good Systems
Leverage multiplies:
- returns
- variance
- drawdowns
- tail risk
If you use leverage, you are betting that:
- volatility stays low
- correlations stay low
- tails don’t appear
- liquidity stays available
These assumptions fail exactly during crises.
Leverage makes the left tail dangerously heavy.
Monte Carlo: The Only Honest Way to See Ruin Risk
Your backtest shows one path. Monte Carlo simulations show thousands.
Simulating randomized sequences of wins/losses reveals:
- how often drawdowns exceed expectations
- how often accounts hit ruin thresholds
- how deep worst-case paths go
- how sensitive the system is to variance
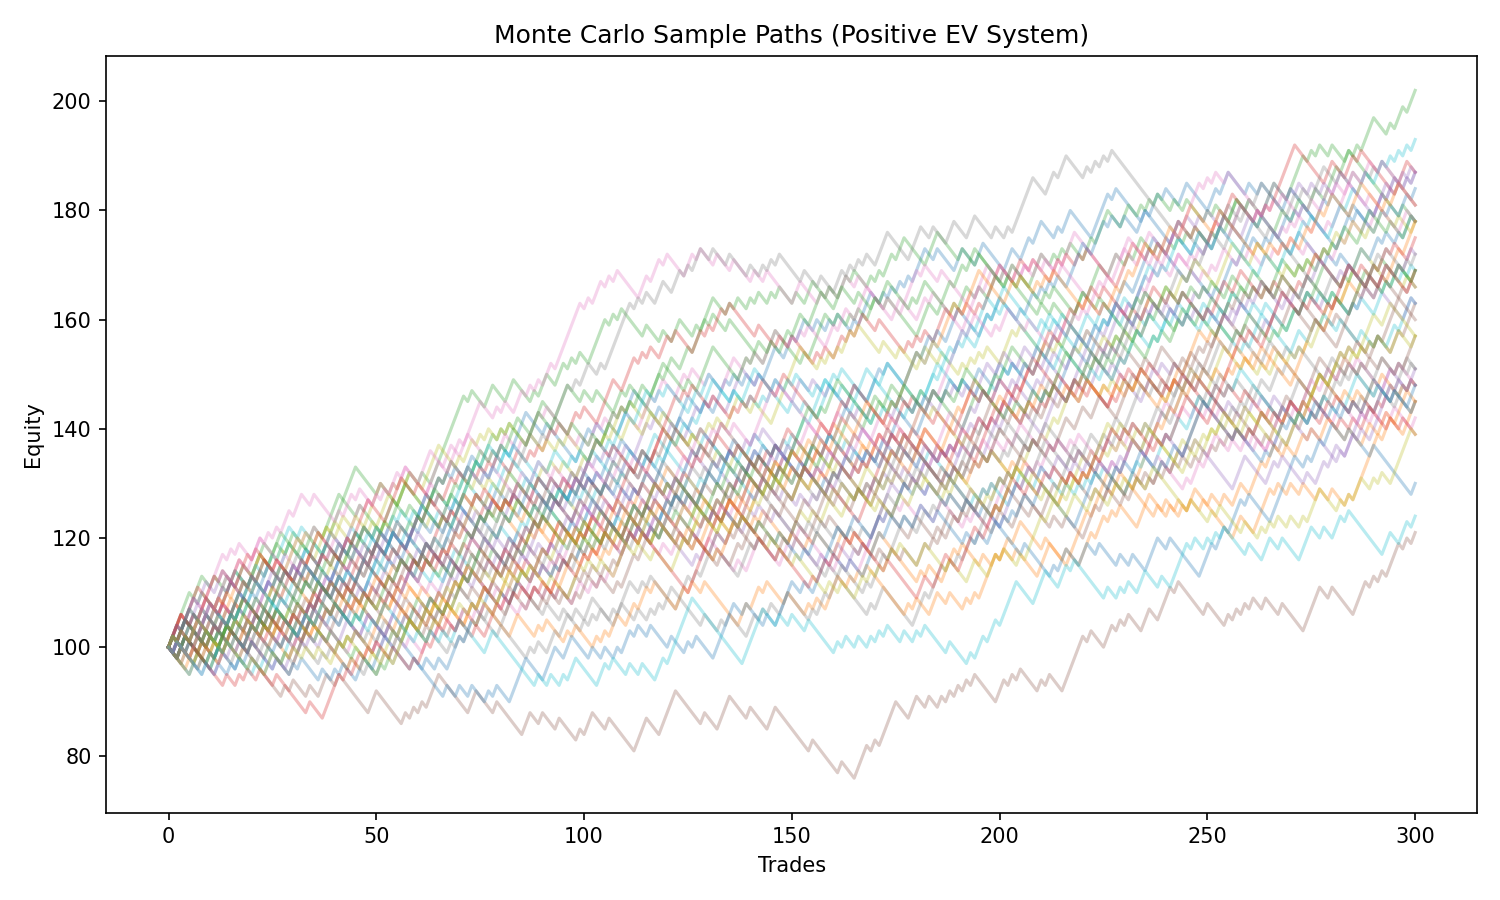
Most traders are shocked when they first see Monte Carlo results.
Even good systems look terrifying under realistic randomness.
Survival Is the Strategy
Professionals know:
- The goal is not to maximize return.
- The goal is to maximize the probability of survival.
Because:
- You cannot realize EV if you’re wiped out
- You cannot recover from catastrophic drawdowns
- You cannot think clearly when down 60%
- You cannot capture tail wins if variance kills you first
Survival first. Profit second.
Key Takeaways
- Variance determines how wild your equity curve is
- Losing streaks are mathematically inevitable
- Drawdowns are the expression of variance through time
- Drawdowns have depth, duration, and frequency
- Variance drag reduces compounded returns
- High variance makes detecting edge harder
- Ruin is possible even with positive EV
- Position sizing determines survival more than edge
- Leverage dramatically increases ruin risk
- Monte Carlo simulation is essential for honest evaluation
Variance is the wind. Drawdowns are the waves. Ruin is sinking.