Mathematics of Trading: Expected Value
The Single Most Important Idea in All of Trading
- If outcomes are uncertain, how do we decide whether a trade is “good”?
- How do we mathematically define whether a strategy is favorable?
- Why can a sound system lose money in the short term?
- What does “on average” actually mean in markets?
- How can we use code and simulations to see expected value in action?
If uncertainty is the environment we operate in, then expected value (EV) is the tool we use to navigate it.
Expected value is the foundation of rational decision making under uncertainty. It is the difference between gambling and running a statistical business.
Most beginners focus on:
- win rate
- recent trades
- what “looks right”
Professionals focus on:
- expected value
- payoff structure
- long-run averages
This post builds that mindset.
What is expected value?
Expected value answers a single question:
If I took this exact trade a large number of times, what would I average per trade?
Not:
- “Will the next trade win?”
- “Did the last trade win?”
But:
“What is this decision worth, on average, across many possible futures?”
This is crucial because in uncertainty:
- single outcomes are noisy
- streaks happen
- short-term results mislead
- long-term averages reveal truth
Expected value is the compass that keeps you oriented when randomness is noisy.
EV as an everyday idea
You already act based on expected value in daily life.
Example: deciding whether to take an umbrella.
You roughly consider:
- probability it will rain
- how much you dislike carrying an umbrella
- how bad it would be to get soaked
You do not need perfect prediction. You choose the action with better expected outcome.
Trading works the same way. The only difference is that we write the idea down mathematically.
At its core:
Expected value is probability-weighted outcomes.
The clean mathematical definition
Let (X) be a random variable that can take values:
with probabilities:
Then the expected value of (X) is:
This is simply:
“Multiply each outcome by its probability and sum them up.”
For a trading strategy with:
- win probability (p)
- loss probability (q = 1 - p)
- average win (W)
- average loss (L)
we can write:
If this number is positive, the system has positive expected value. If it is negative, the system is mathematically doomed.
Fair vs favorable game: a simple example
Consider a game:
- 50 percent chance to win +1
- 50 percent chance to lose -1
This is a fair game. You should not expect to make or lose money over many plays.
Now change the payoffs:
- 50 percent chance to win +2
- 50 percent chance to lose -1
Now the game has positive expected value.
You still lose half the time. You still see losing streaks. But if you play long enough, you expect to gain 0.5 units per play.

This chart shows the two possible outcomes (+2 and -1). EV is not visible in any single outcome; it lives in the combination of value and probability.
Why win rate means nothing without EV
People love high win-rate strategies. They feel safe and consistent. But win rate alone is meaningless.
Compare two systems:
Example A: low win rate, excellent performance
- Win probability: 30 percent
- Average win: +200
- Loss probability: 70 percent
- Average loss: -50
Positive EV. Fantastic strategy in expectation.
Example B: high win rate, terrible performance
- Win probability: 90 percent
- Average win: +50
- Loss probability: 10 percent
- Average loss: -500
Negative EV. This will eventually blow up.
Strategy B will “feel” great most of the time and then periodically nuke the account.
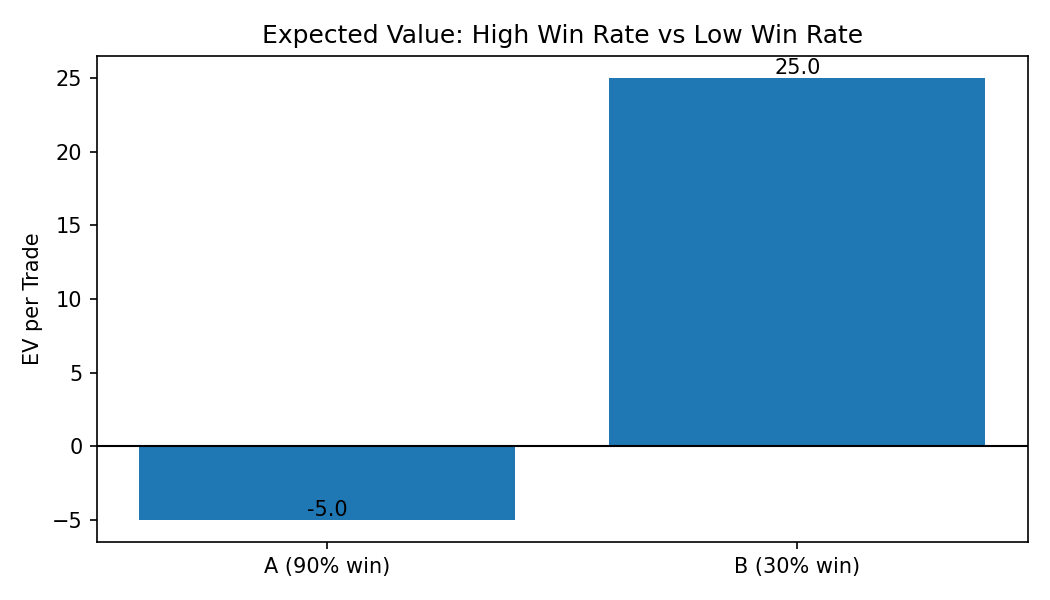
The main lesson:
Win rate is a feeling. Expected value is reality.
EV in trading terms
In trading, every decision has a payoff profile.
You might define payoffs in:
- raw currency (e.g. dollars)
- R-multiples (risk multiples, e.g. win = +3R, loss = -1R)
- percentage returns
For example, suppose:
- win probability (p = 0.45)
- average win = +2R
- average loss = -1R
Then:
On average, you earn 0.35 units of risk per trade. Over 100 trades, the expected gain is 35R (before costs and slippage).
You still see randomness in realised PnL, but EV describes the center of that randomness.
Expected value only appears in the long run
This is where many people struggle.
- A good decision can lose
- A bad decision can win
- A profitable system can have a losing month
- A terrible system can have an amazing month
One trade means nothing. Ten trades mean very little. A hundred or more start to reveal the underlying EV.
Expected value is a long-run concept.
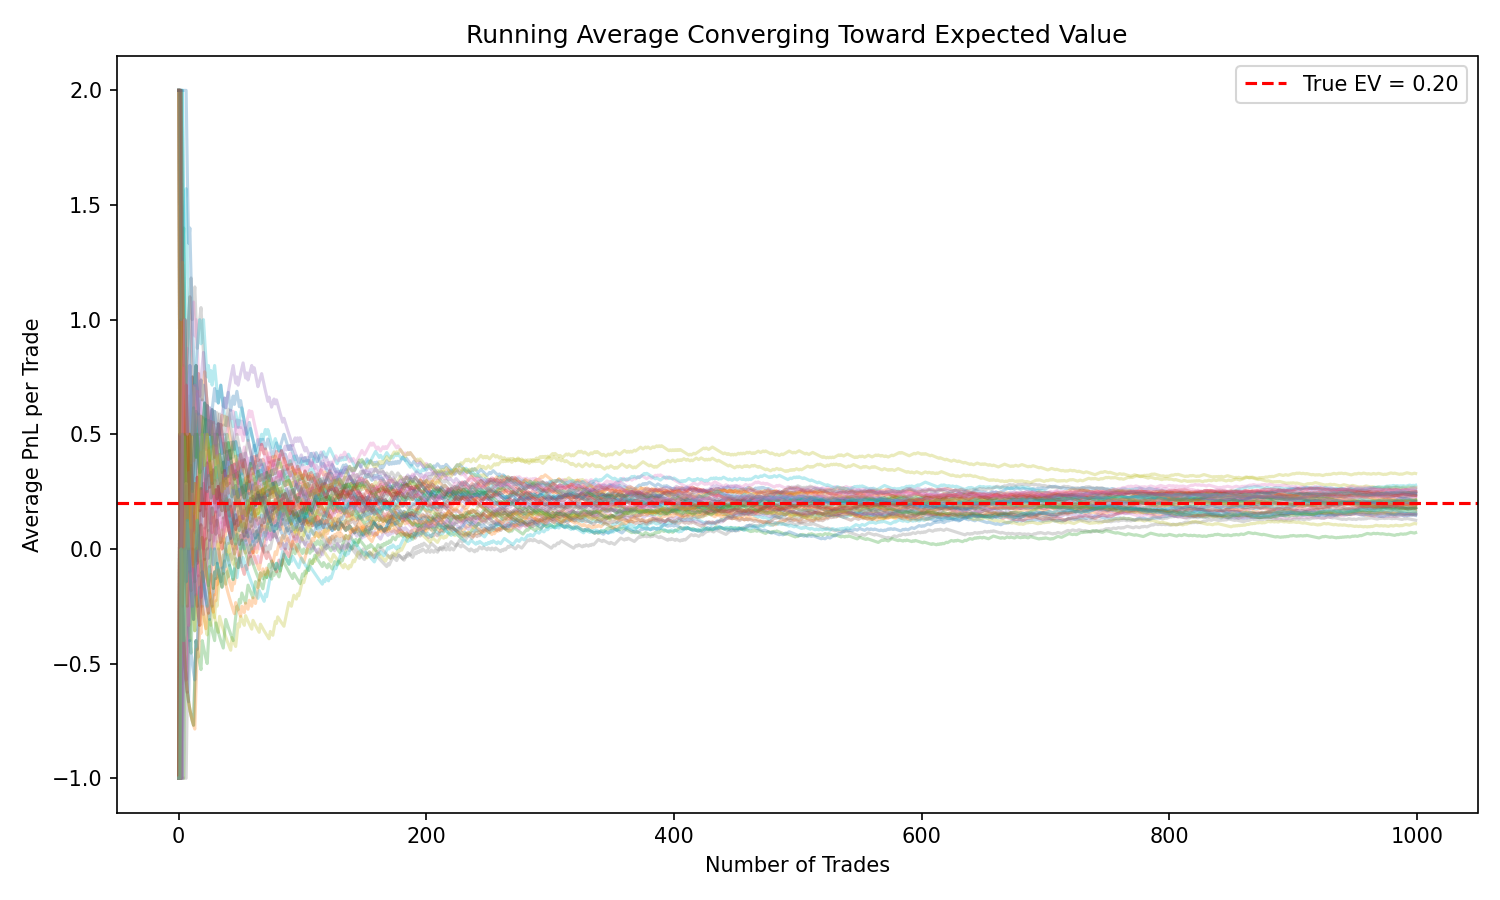
Early on, the running average jumps around violently. As the number of trades grows, it slowly stabilizes near the true EV.
This is the Law of Large Numbers in action:
You cannot judge a strategy on a handful of trades.
Visualizing EV with simulated equity curves
Let’s take a simple positive-EV system:
- Win probability = 0.4
- Average win = +2
- Average loss = -1
EV per trade:
Now simulate many possible paths of 300 trades each.
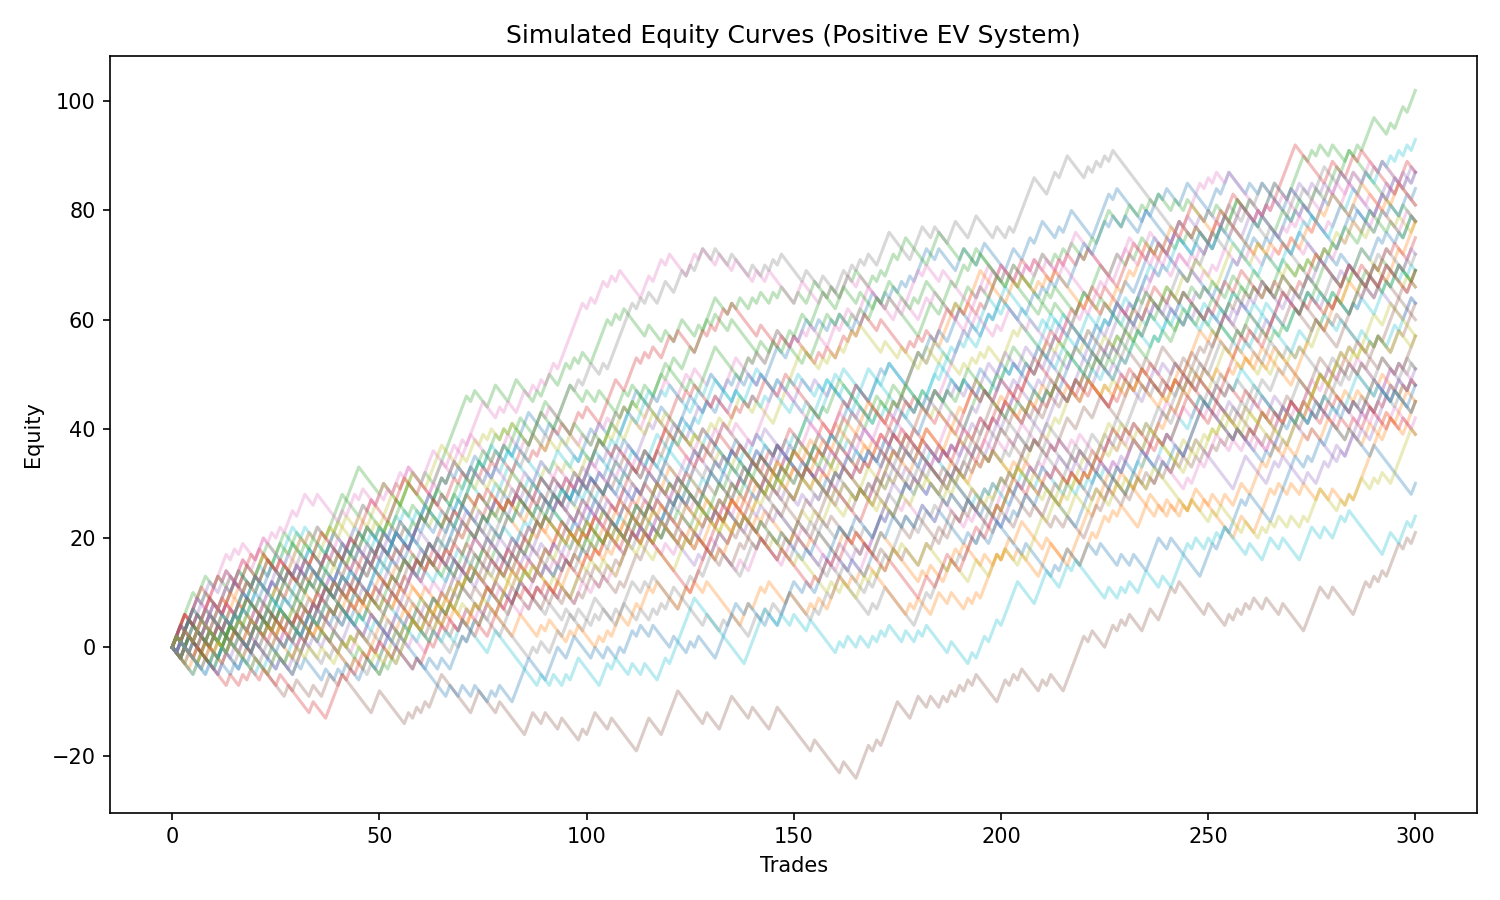
What you see:
- all paths share the same EV
- some paths start badly and recover
- some start great and then chop sideways
- many are noisy and uneven
- on average, they tend to drift upward
This shows two important truths:
- Positive EV does not guarantee a smooth ride.
- The same EV can produce very different experiences across paths.
This is where variance, drawdowns, and risk of ruin enter the picture in later posts.
Good decisions vs good outcomes
In a deterministic world:
- good decision → good outcome
- bad decision → bad outcome
Markets do not work that way.
Because of randomness:
- a high-EV trade can lose
- a negative-EV trade can win
If you judge decisions purely by short-term outcomes, you will:
- abandon good systems after a losing streak
- fall in love with bad systems that got lucky
- chase noise instead of edge
Expected value is how you evaluate process quality, not single outcomes.
Over time, the question becomes:
“Am I repeatedly making decisions with positive EV?”
rather than:
“Did my last trade win?”
EV forces you to think about the cost of being wrong
EV isn’t just about how often you’re right. It forces you to ask:
How much do I lose when I’m wrong vs how much I win when I’m right?
This is where skew comes in:
- Positive skew: many small losses, occasional large wins
- Negative skew: many small wins, occasional large catastrophic loss
Both can have the same win rate. Both can feel very different emotionally. Both can even have the same EV.
Expected value lets you:
- see through high win-rate illusions
- appreciate low win-rate but high-reward systems
- understand that “being right” is less important than “getting paid when you’re right”
EV is necessary, but not sufficient
Expected value tells you:
- where you are headed on average.
But trading is experienced as a path over time, not an average.
EV does not capture:
- variance of outcomes
- volatility of PnL
- length and depth of drawdowns
- clustering of losers
- psychological difficulty
- probability and timing of ruin
Two strategies can have the same EV and:
- very different equity curve volatility
- very different drawdown profiles
- very different ruin probabilities
So:
- EV is necessary for a good strategy
- But EV alone is not enough
The rest of the series dives into:
- edge (EV > 0)
- variance
- drawdowns
- risk of ruin
- modeling randomness
- Monte Carlo simulations
EV is the first piece of the puzzle, not the last.
Key takeaways
- Expected value is the probability-weighted average outcome
- Win rate is meaningless without payoff structure
- A high win rate can hide negative EV
- A low win rate can be extremely profitable with strong payoff asymmetry
- Positive EV shows up only over many trades
- Individual trades are noise; EV is a long-run statistic
- EV evaluates process quality, not single outcomes
- EV is the foundation of edge, risk, and strategy evaluation